Reliable Analysis Made Easy
Regression Application

ADVANCED ANALYSIS Visualizing Decision Making

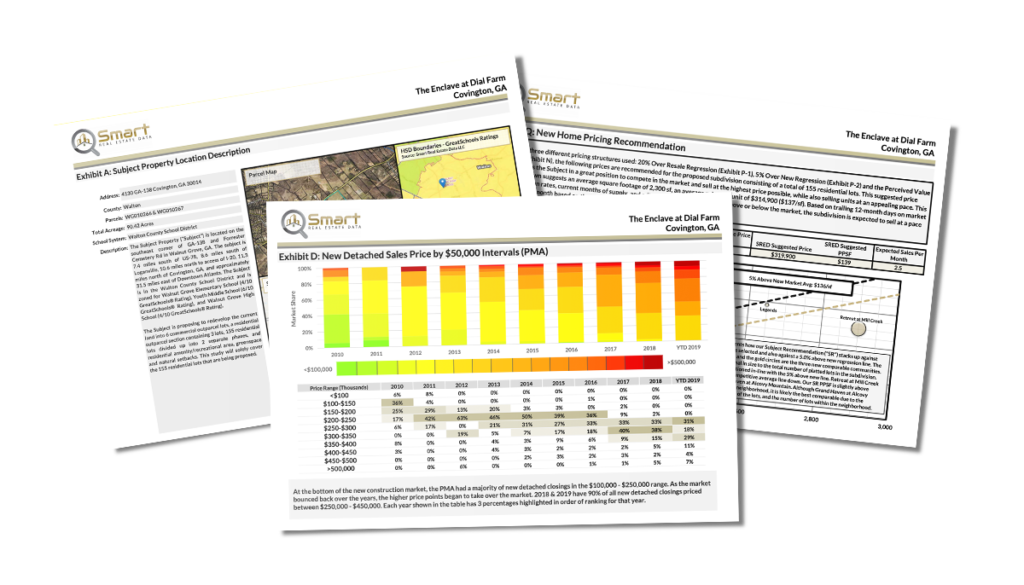
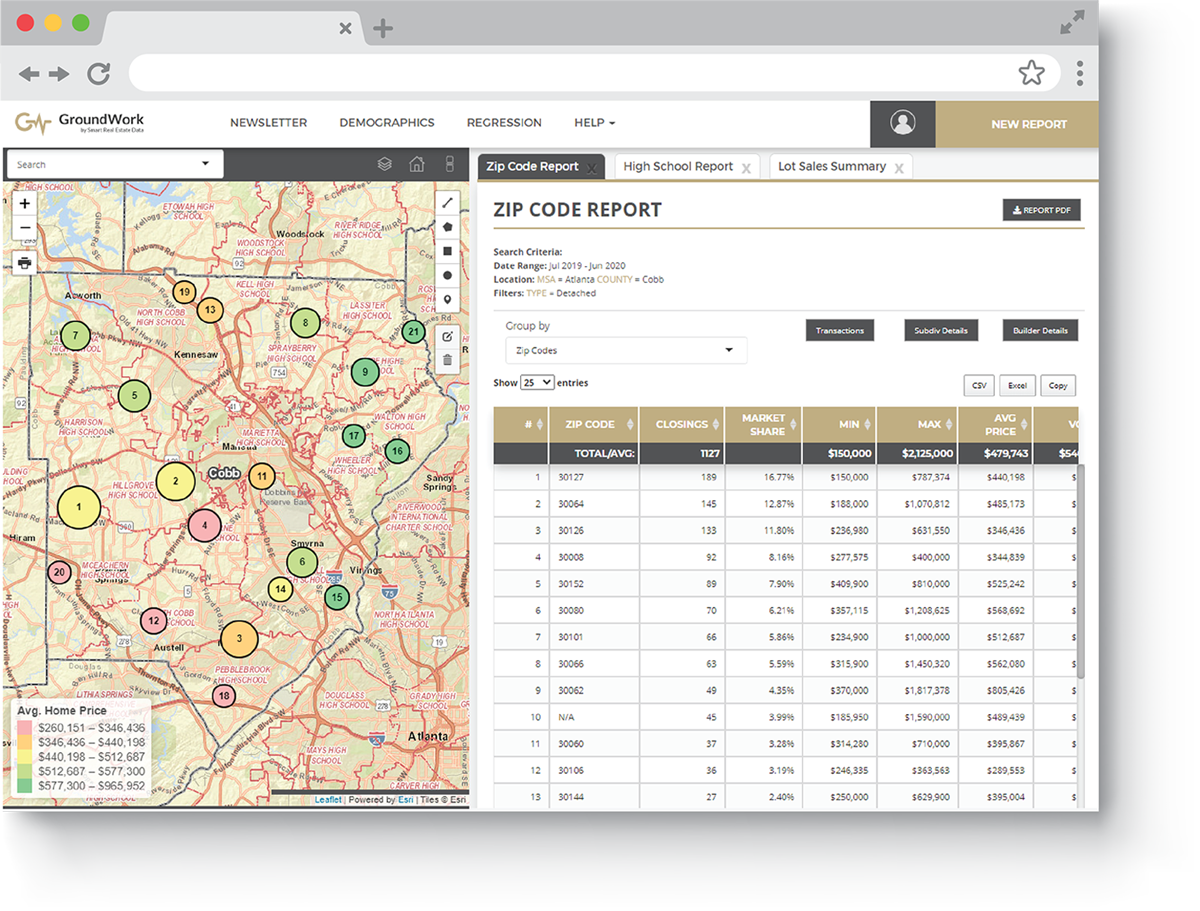
You cannot rely solely upon listing services to run your analysis. Most often, they only provide a fraction of the picture required to make educated decisions. Our new regression application leverages our new construction database, complemented by the crowd sourcing capability of resales, then circulated through tax assessor systems to provide you with the most accurate volume and statistics on the web. Users can then build custom data segments to run the following dynamic reports:
gwmocup
Responsive Design

Responsive Design

Statically plotted data does not allow you to compensate for outliers. Our Application allows users to easily remove unwanted records from their analysis, and automatically recalculate the data's relationship.

Saved Profiles

Saved Profiles

Our Application makes it easy to build and save your unique searches for future use. By using our saved searches function, users can refer back to their specific queries, alter individual segments and run new reports upon updated data sets.

Quick Reports

Quick Reports

The reporting capabilities within our Regression Application allows users to organize their research into a finalized PDF.

Custom Segments

The breadth of filtering methods makes it simple for you to tailor your comparable data set in order to generate more accurate and meaningful reports. Build and analyze specific data segments across 20 structural characteristics and location factors.

That is over 325,000 unique segments within a single zipcode/High School/Elementary cross section!

want to learn more?

Request Free Sample Reports Today

Discover how our data can augment your decision process and provide security for your investments.

Regression Reports

  • Select Your Reports:

    Please select any sample reports you would like to receive.